BizMachine E-commerce Insights: Comparing the Czech, Slovak, and Hungarian Markets

13.9.2023

5 min
reading time
13.9.2023
5 min
reading time
Although the Czech Republic and Hungary are comparable in terms of population, when it comes to business and specifically e-commerce, these two countries are more different than alike. Hungary is in many ways similar to Slovakia, which has an almost half-sized market in terms of potential customers. But the differences compared to the Czech Republic are just beginning there.
Based on the total number of business entities in the Czech Republic (2,807,210), one could say that statistically speaking, every fourth Czech person runs a business, while in Slovakia and Hungary it's every fifth resident. The Czech Republic also traditionally boasts the highest number of e-shops, even relative to the total number of business entities. In mid-August 2023, according to BizMachine data, there were 63,321 e-shops on the Czech market. There were more than 47,000 companies with at least one e-shop, representing 1.68% of all business entities. This means there are nearly 6 e-shops per thousand residents in the Czech Republic, while Hungary has roughly 3.2 e-shops per 1,000 residents. Slovakia, with 4.4 e-shops per 1,000 residents, falls between its two neighbors in this statistic. Moreover, companies that operate e-shops have higher revenues precisely in the Czech Republic. Those with revenue over EUR 5 million account for 5% here, while in Slovakia and Hungary it's 3 percent.
"When looking at our data, we can also add that in the Czech Republic, it's more common for a single company to operate multiple e-shops. The record holder in our market is the Ostrava-based company GEMINI CZ 2000, s.r.o. In total, we identified more than 400 unique domains belonging to this organization on which an e-shop was operated. We currently classify 26 of them as healthy, active e-shops. But for instance, there are 3,113 companies operating at least three e-shops in the Czech Republic, ten times fewer in Slovakia, and 817 such companies in Hungary," adds Yekaterina Bobrakova, an analyst at BizMachine, with interesting statistics.
Although similar e-commerce players operate across all markets, including e-commerce aggregators and marketplaces, their penetration differs across all three markets. While nearly 72% of Czech e-shops can be found on aggregators, in Slovakia it's only 67%, and in Hungary less than a quarter. Aggregators in Hungary are mostly used by companies with revenue under EUR 1 million. On the Slovak market, you're more likely to find an offer from a company running an e-shop with revenue between EUR 1–5 million on a comparison portal than one with revenue under EUR 1 million.
The proportion of e-shops on aggregators also goes hand in hand with the number of reviews collected. Czech e-shops with more than a thousand public reviews account for nearly 6% of all e-shops, while in Hungary it's around 3%. On the other hand, only 6.6% of e-shops in Hungary have more than 100 reviews (in the Czech Republic, one fifth of e-shops have at least 100 reviews).
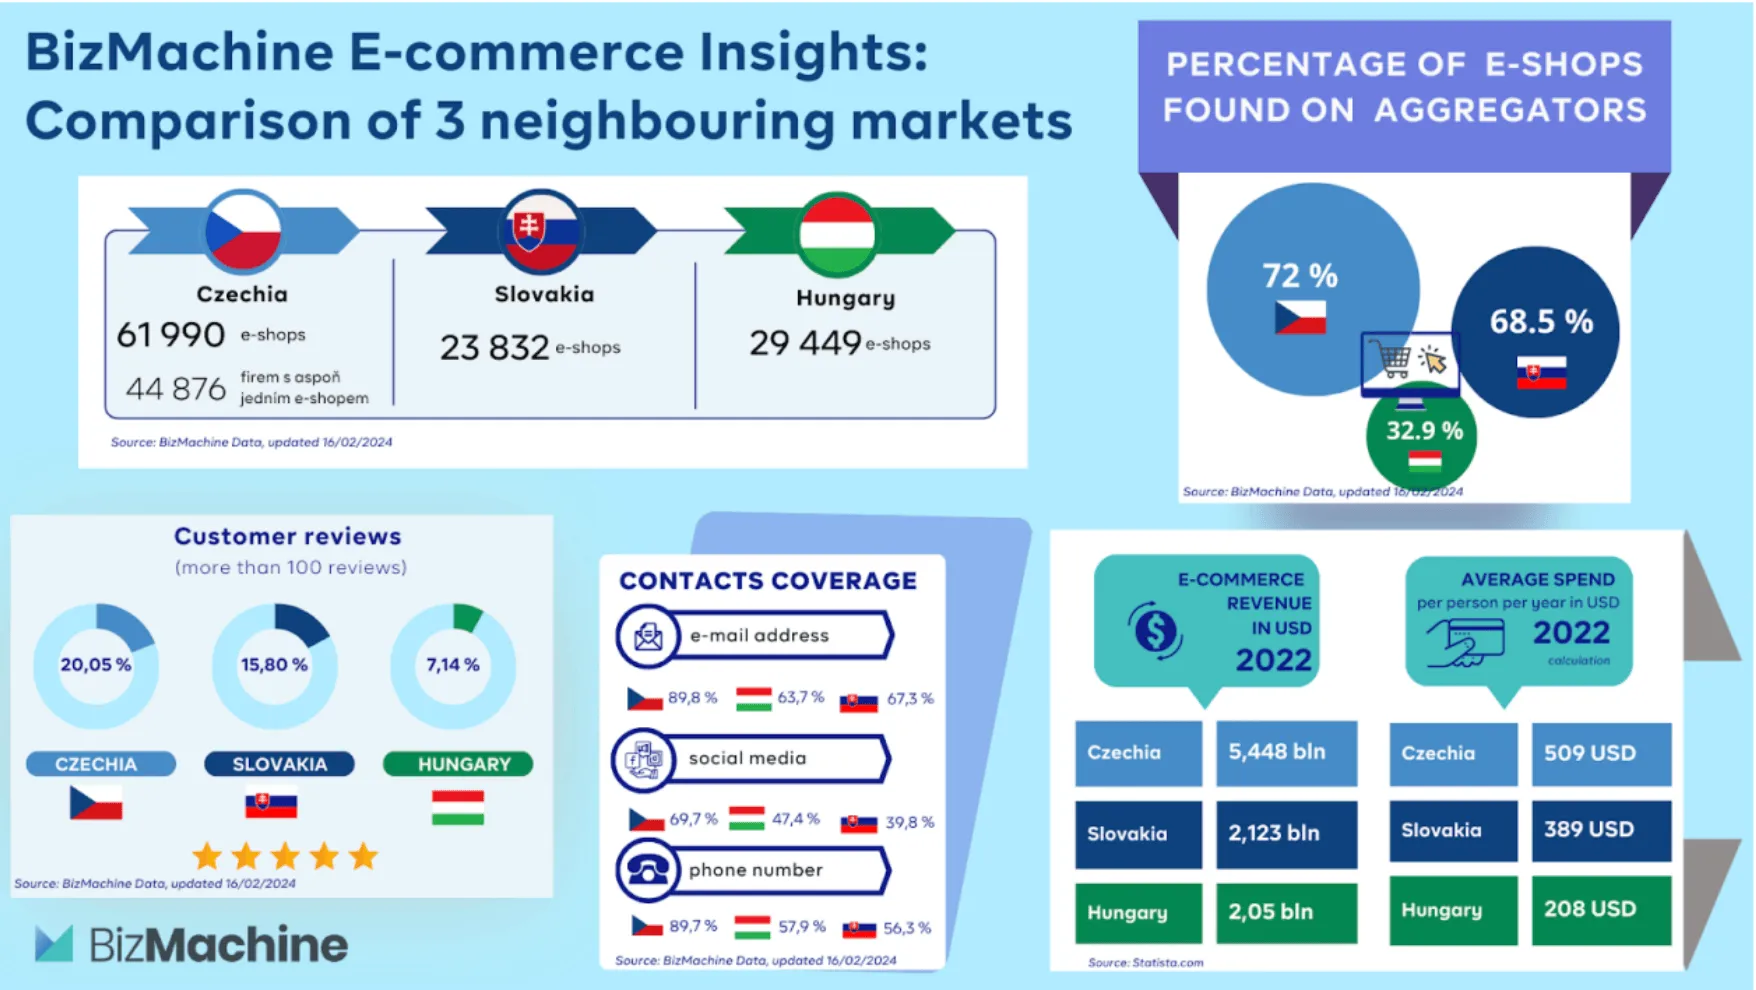
The fact that they're not as often on aggregators doesn't mean that Hungarian or Slovak e-shops invest more in their promotion. Only 4% of Hungarian companies with an e-shop pay for Google search keywords. In Slovakia it's 7%, and in the Czech Republic up to 9%. Interestingly, based on available sources, these investments in performance advertising correspond to the average annual e-commerce spending per capita in each country. For example, for 2022, calculations from Statista.com* and BizMachine data showed that in the Czech Republic, the average annual e-commerce spending per capita was more than double that of Hungary (USD 509 vs. USD 208). Slovak consumers maintain average spending at a similar level to their Czech neighbors (USD 389).
Differences can also be found in the accessibility of e-shops for their customers. Slovak e-shops are the least accessible. They are the least likely to have a public email address or phone number. Slovak and Hungarian e-shops also less frequently have social media profiles (only 38% of e-shops in Slovakia and 47% in Hungary, compared to nearly 67% of e-shops in the Czech Republic).
*Note: Unfortunately, publicly available data describing all three markets based on the same methodology cannot be found. In our own calculations, we used data and press releases from APEK for the Czech Republic, Heureka for the Slovak market, and several sources about Hungary, including data from CzechTrade and the Embassy of the Czech Republic. To compare markets, we wanted to use a unified methodology across countries, so we worked with data from Statista.com, which probably underestimates the size of the Czech market, but we found it sufficient for comparison purposes.

Tereza Rejchrtova
Tereza Rejchrtova helps people understand how to use data to their advantage. She has over five years of experience in SaaS marketing, specializing in product and content marketing for B2B. She focuses on connecting complex topics with clear, accessible content.

Pernerova 697/35
186 00 Praha 8
Czech Republic

+420 735 121 860
